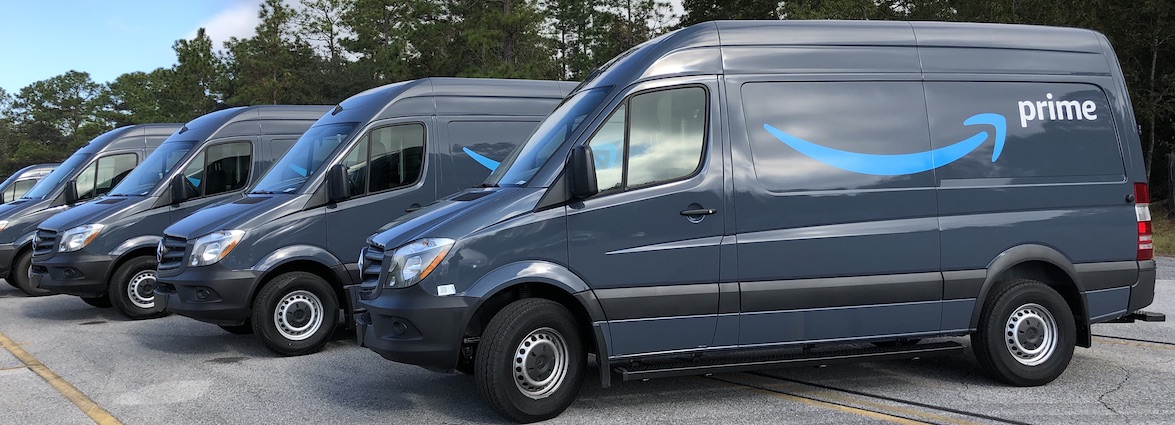
Routing a package-carrying van to your doorstep is a classic example of the traveling salesman problem. Few companies know more about this than Amazon. Tens of thousands of their drivers hit the road every day, each taking a Prime van in a TSP tour through 150 or more customer stops, starting and ending at a depot station. And behind the scenes an Amazon research division is constantly looking for ways to improve the efficiency and safety of their routes. The last mile in package delivery.
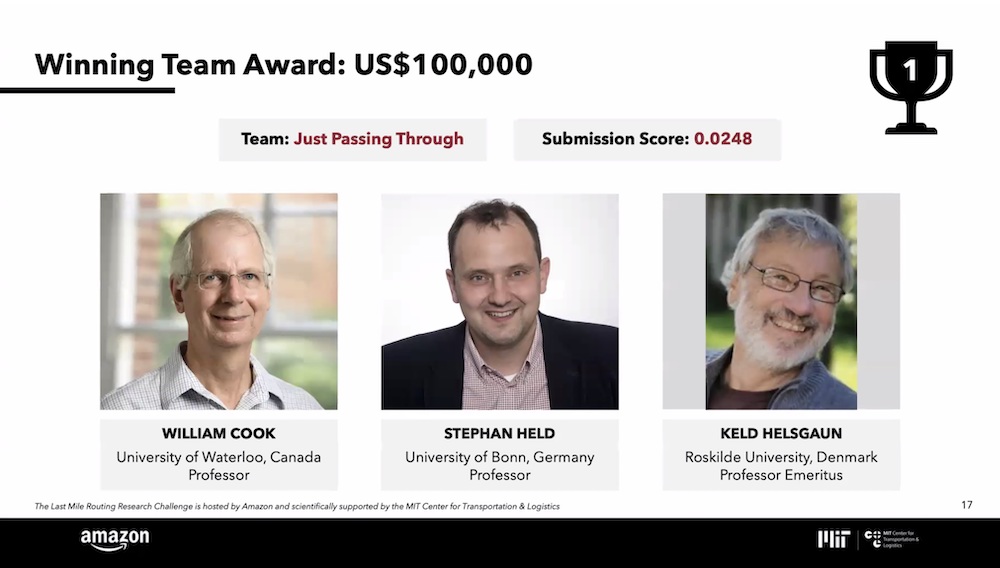
As part of this effort, the Amazon Last Mile Routing Research Challenge was announced in January 2021. The competition's $175,000 prize money drew 2,285 participants from around the globe, including our team, Just Passing Through, with members William Cook, Stephan Held, and Keld Helsgaun.
The organizers describe the challenge as follows.
"The goal of the Last Mile Routing Research Challenge is to encourage participants to develop innovative approaches leveraging artificial intelligence, machine learning, deep learning, computer vision, and other non-conventional methods to produce solutions to the route sequencing problem which outperform traditional, optimization-driven operations research methods in terms of solution quality and computational cost.
Given a large, realistic data set of delivery requests and their characteristics, participants will be asked to generate route sequences that perform well on a given set of performance metrics by learning from actual route sequences that were operated by actual experienced drivers."
Ouch! We are all card-carrying traditional optimizers on Just Passing Through. Operations research is the name, optimization the game.
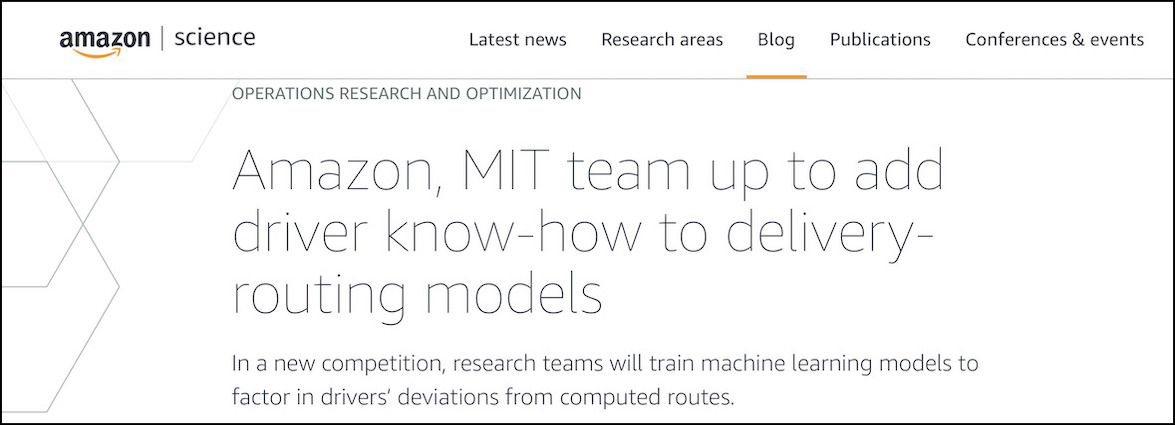
Hurt feelings aside, the key phrase in the above description is "given set of performance metrics." Rather than the standard TSP objective of minimizing total travel distance, the competition asks for tours that closely match those taken by experienced drivers. This seems a surprising choice at first glance. If drivers can find good routes, why not let them go to it? The short answer is that they are not building their routes from scratch. Indeed, an Amazon Science blog indicates drivers are presented with computed tours that they adjust on-the-fly.
"Drivers, however, frequently deviate from those computed routes. Drivers carry information about which roads are hard to navigate, when traffic is bad, when and where they can easily find parking, which stops can be conveniently served together, and many other factors that existing optimization models don't capture."
These computed tours were not made available, but the "mimic-the-driver" metric directed challenge competitors towards global features (likely due to Amazon algorithms), together with local adjustments (made by drivers, based on their preferences). The hoped-for outcome is an algorithm to quickly compute efficient tours that drivers are happy to follow.
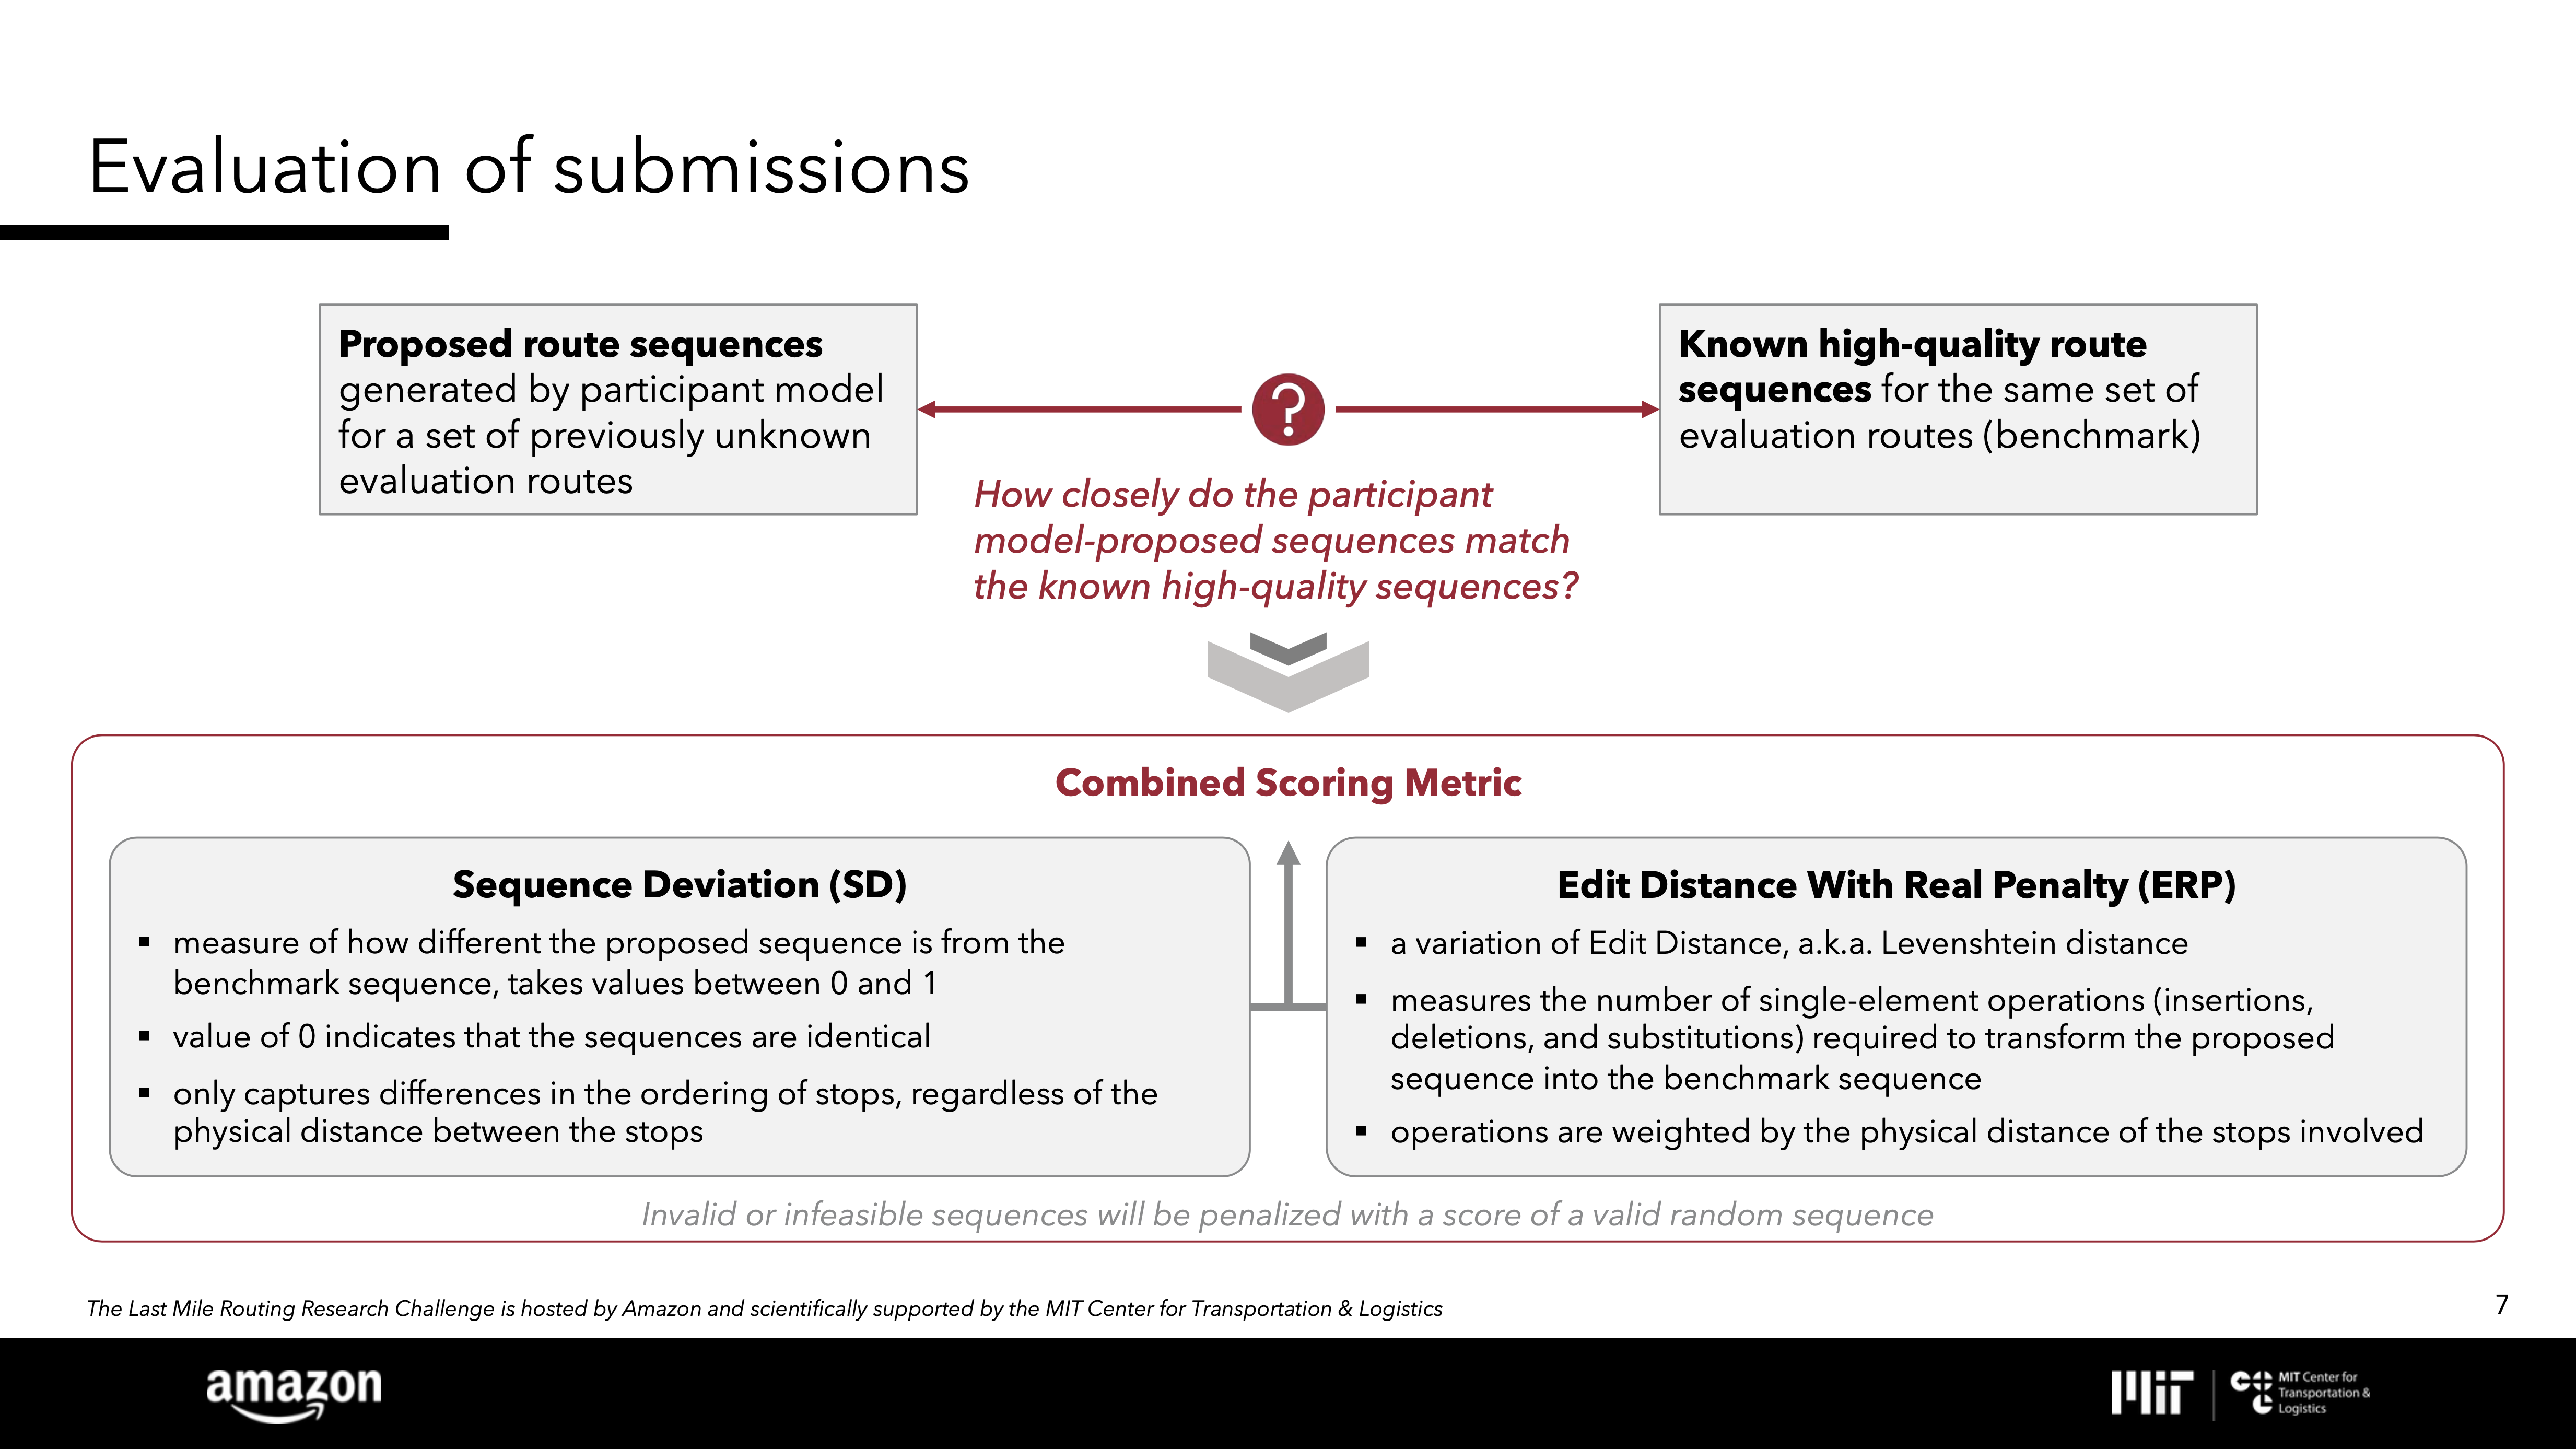
A kick-off webinar took place on March 8, 2021. It was here participants learned details of the metric to be used in the competition scoring. It's a complex metric, combining two ways to measure the difference between two tours, one involving only the positions of the stops in the tours and the other also taking into account the travel distance between stops. The two measures are multiplied to produce a single numerical score, the lower the better, with a perfect match of the driver route receiving 0.0.
The competition itself got underway on March 15, 2021, with a massive release of routing data. Participants received a total of 6,112 routes. This is far and away the largest collection of real-world TSP instances ever released. Researchers are delighted when they get access to a handful of new models, and here we have thousands.
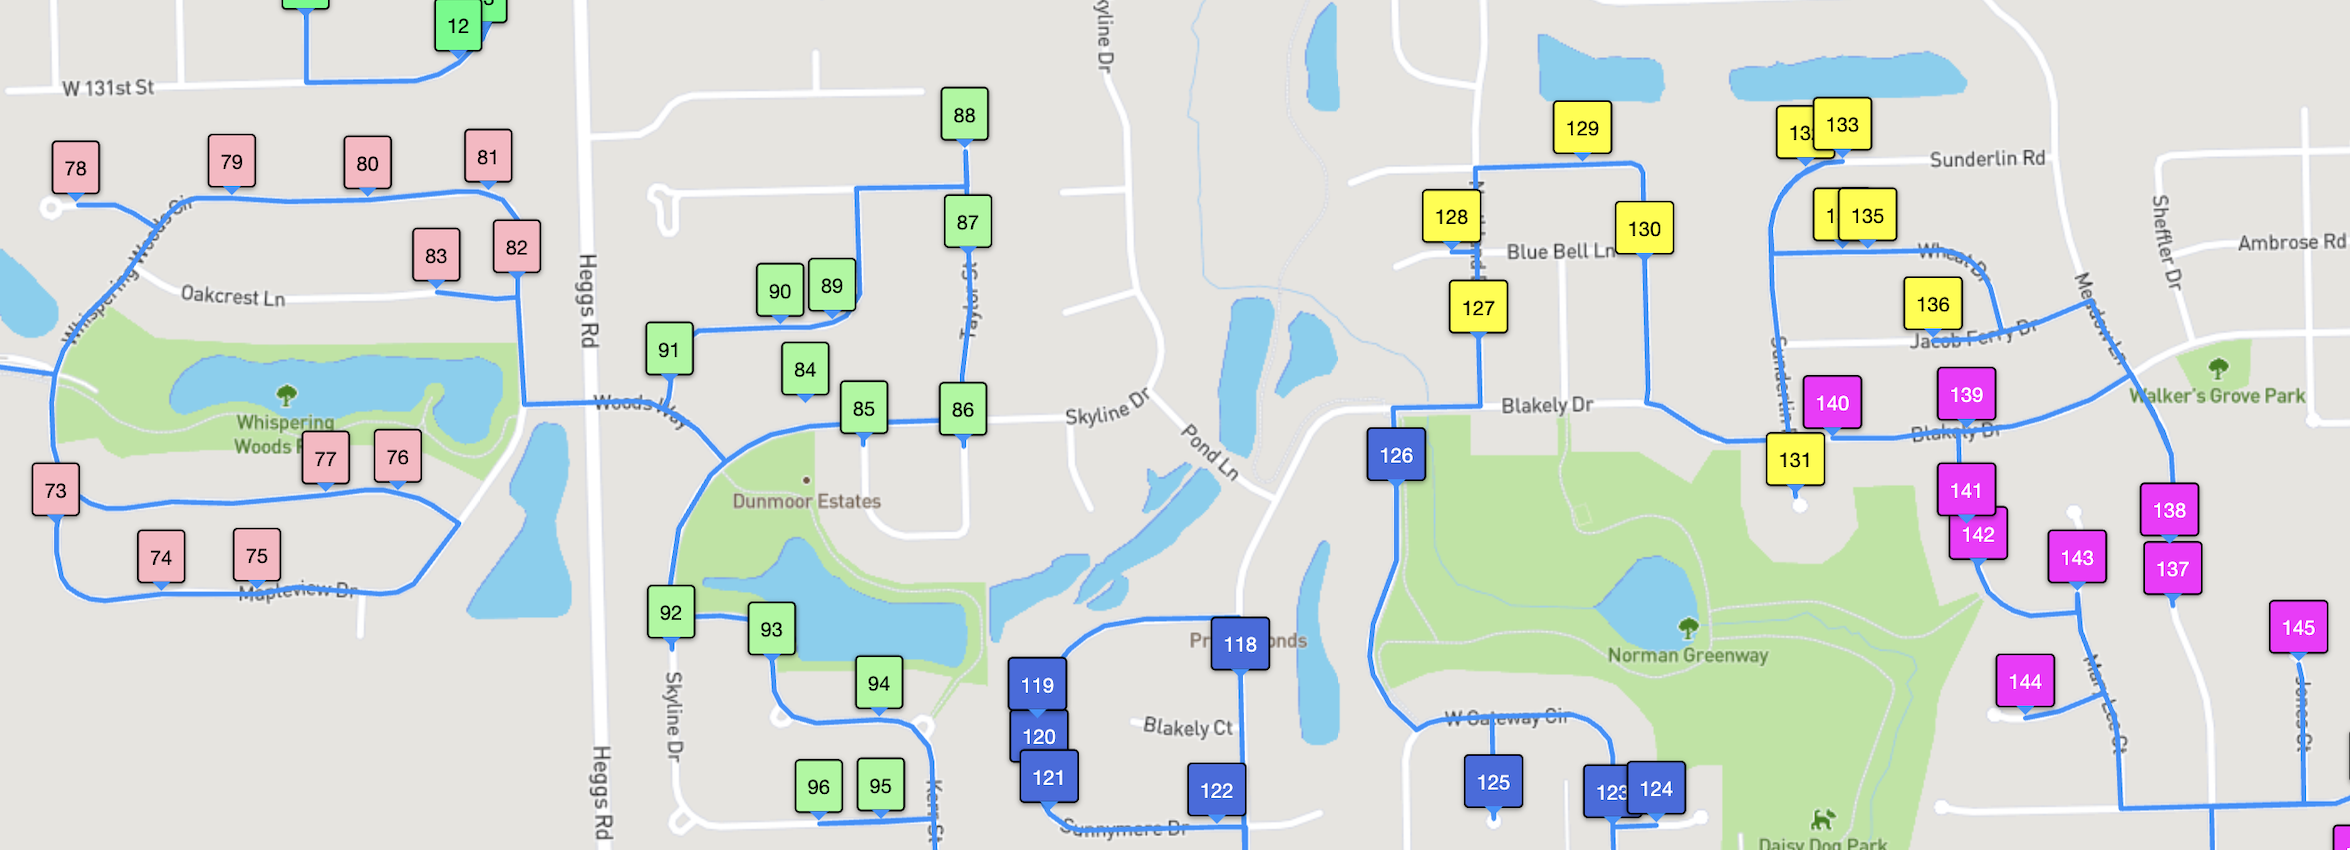
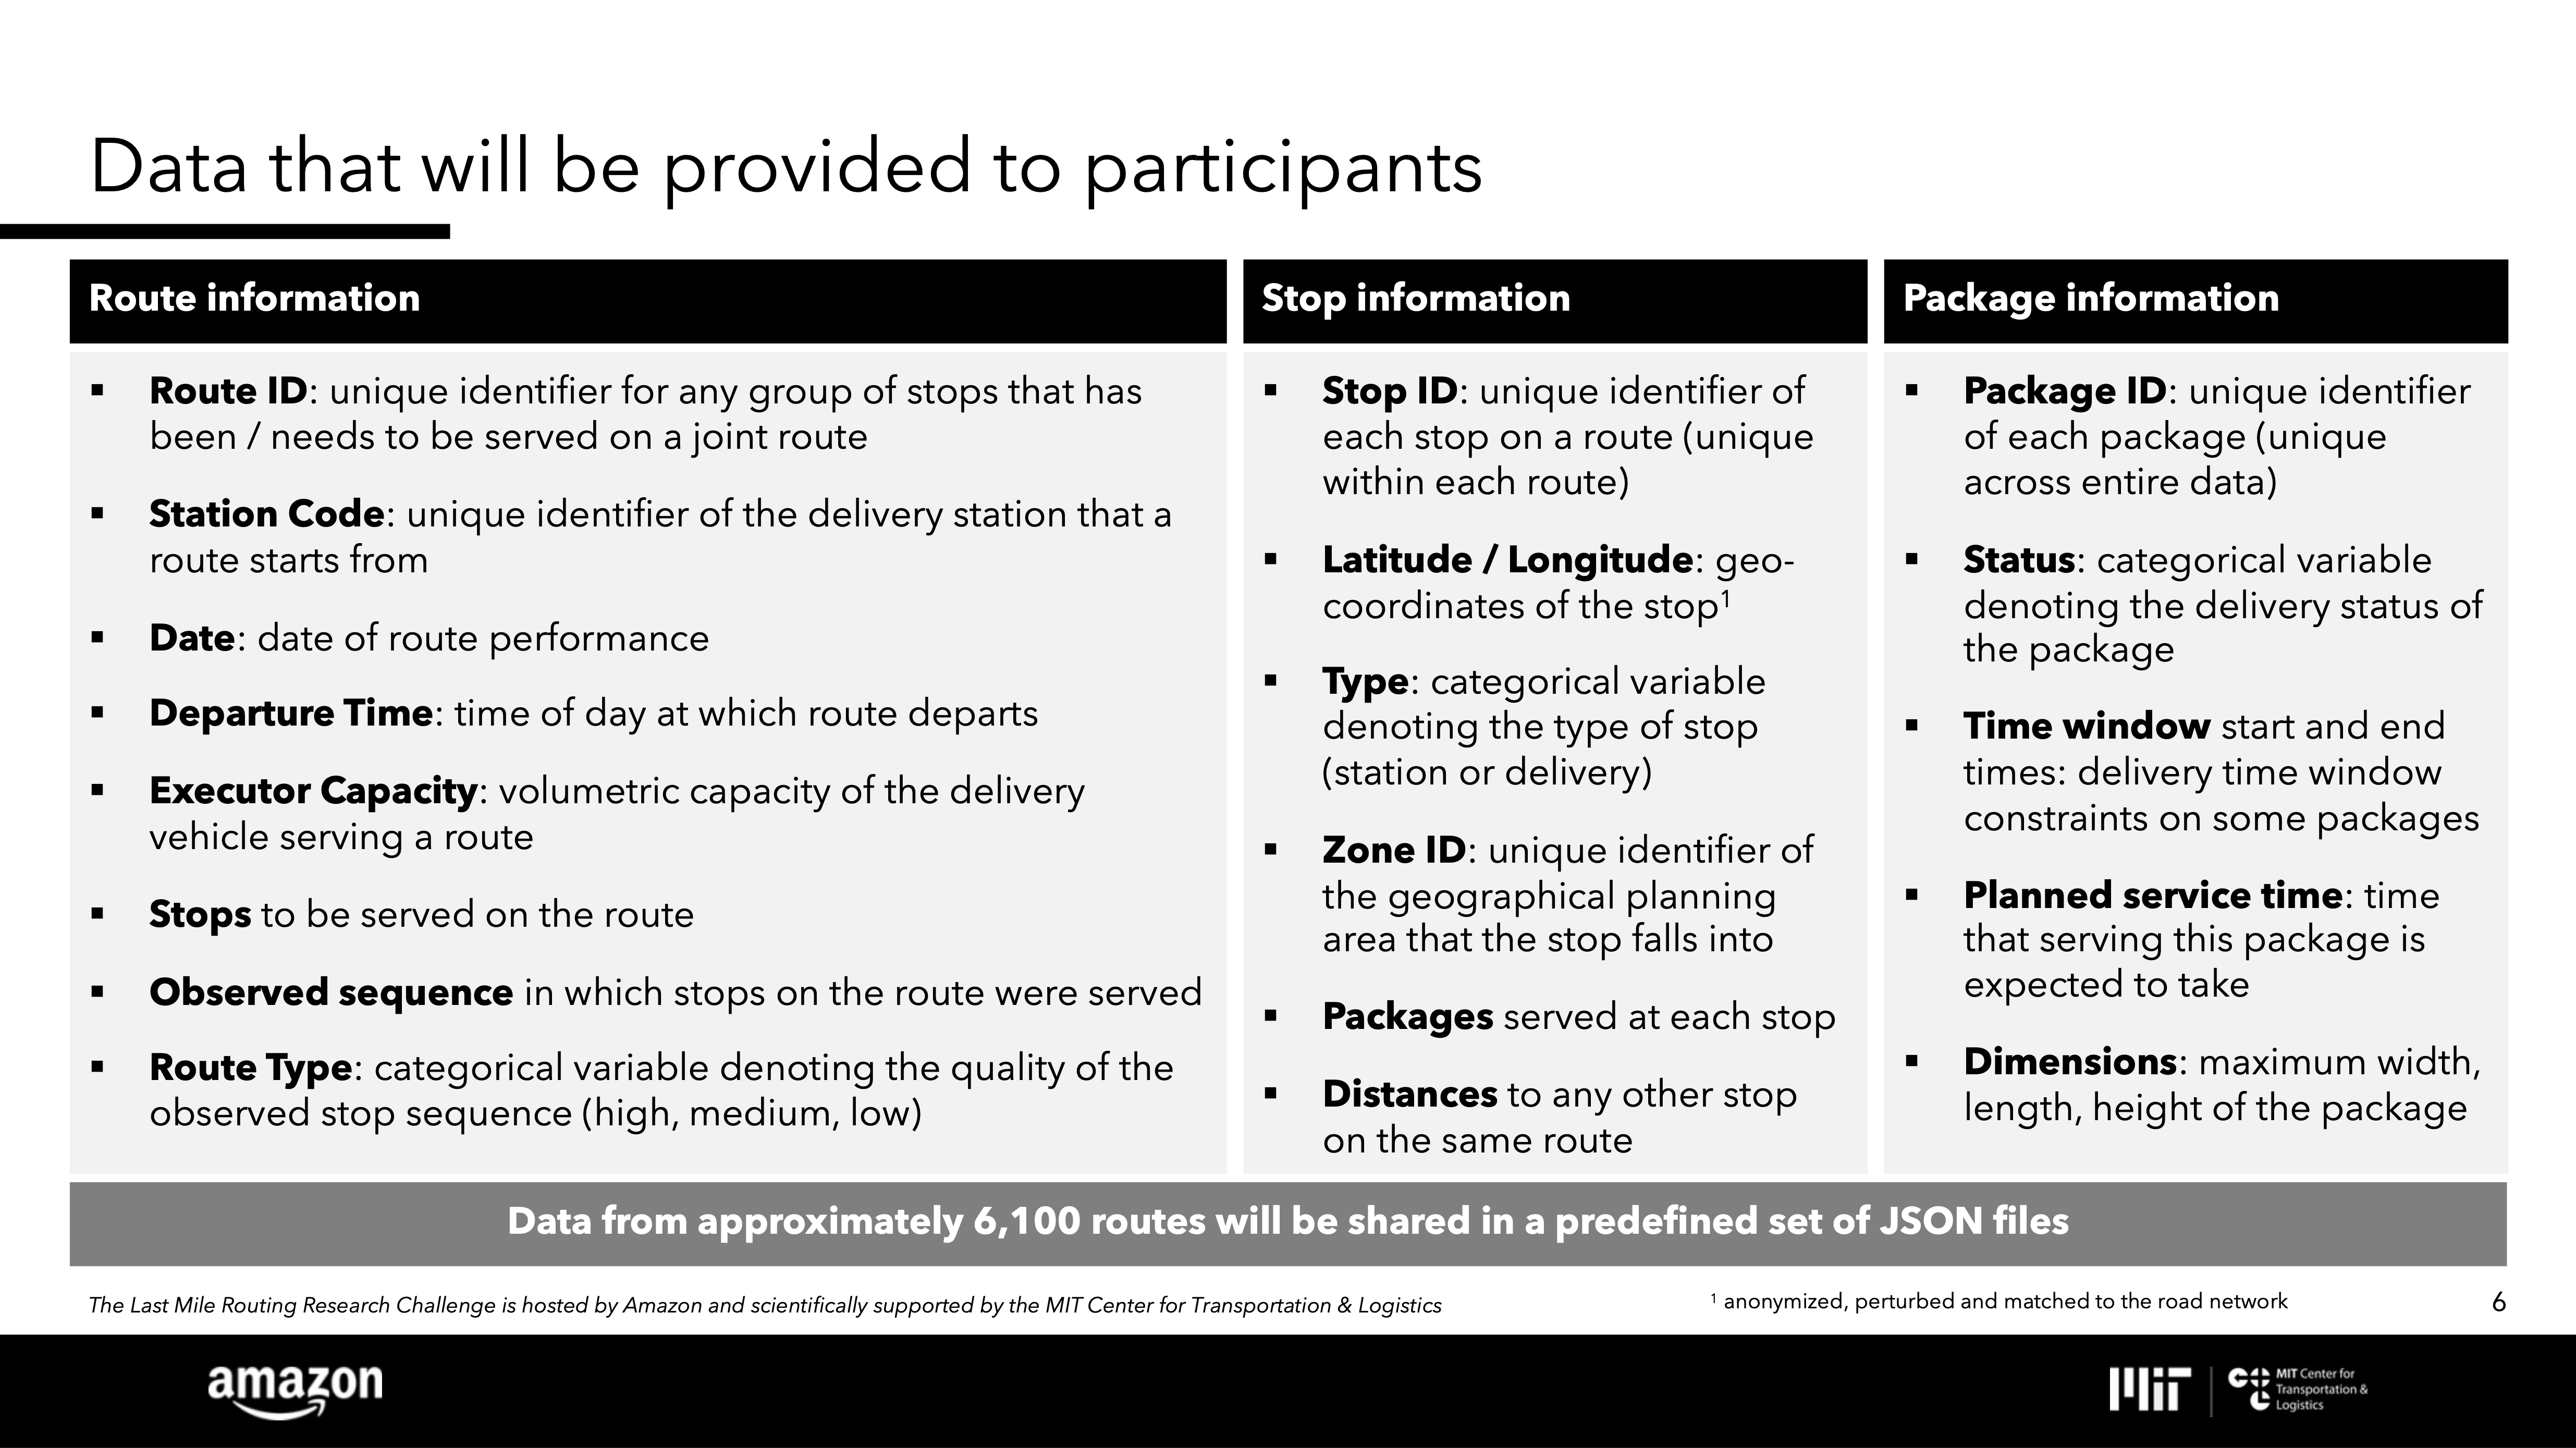
Each of the 6,112 routes originates at one of 17 depot stations and consists of a collection of stops to be visited by a driver. The number of stops ranges from a low of 32 to a high of 237. The mean number of stops is 148. For each stop to be visited, the data include the travel time in seconds to all other stops on the route, a sort zone ID, latitude and longitude, information on the sizes of packages to be delivered, and more. You can view map drawings of a sample of the data sets, one for each of the stations, on the Routes page.
The data also include, for each route, the actual sequence of stops in the tour that was followed by the van driver. It's these tours we are asked to mimic in our algorithm, without, of course, having access to the sequences. In the data set, each of the driver tours is classified as "High" quality (2,718 instances), "Medium" quality (3,292 instances) or "Low" quality (102 instances).
A portion of the driver tours include return visits to a stop, due to an undelivered package during an initial visit. The routes in the final scoring phase are limited to those with High quality driver tours and no undelivered packages (so no return visits to stops). There are 1,107 such routes in the training data.
In the final scoring round, submitted computer codes were evaluated on a test set of 3,050 routes that had not before been seen by the competitors. Evaluation runs were carried out on an Amazon AWS EC2 m5.4xlarge server with a time limit of 12 hours for a build phase (where information is extracted from training instances; during this phase codes do not have access to the 3,050 new instances) and 4 hours for an apply phase (where tours are proposed for the 3,050 new instances).
The submission deadline was June 18, 2021 and winners were announced in an awards ceremony on July 30, 2021. It was a long wait, but a happy ending when we learned our optimization-based code achieved the top score by a substantial margin.
Here are the three prize-winning teams and their respective scores.
• $100,000, Just Passing Through (that's us), score 0.0248
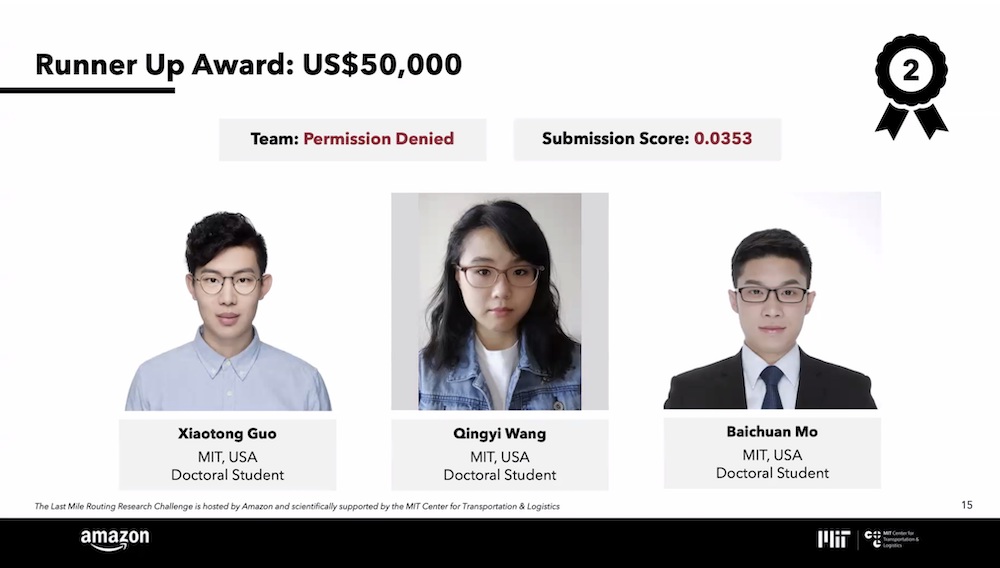
• $50,000, Permission Denied, Xiaotong Guo, Qingyi Wang, and Baichuan Mo (MIT), score 0.0353
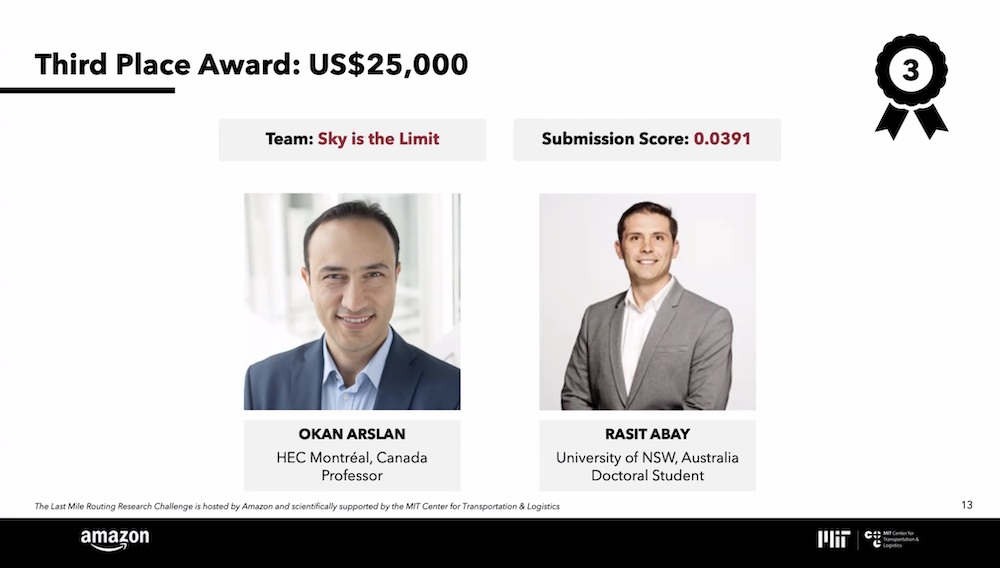
• $25,000, Sky is the Limit, Okan Arslan (HEC Montreal) and Rasit Abay (University of New South Wales), score 0.0391
The fourth-placed MEGI team, with members Antonio Ramos and Manuel Lopes (Polytechnic of Porto), also had a very good score of 0.0436. Following their result, the leader board is closely packed, with the 5th-placed team scoring 0.0484 and the 9th-placed team 0.0504. The many interesting ideas produced by all competing teams can be found in the challenge technical proceedings.
For details of our team's algorithm see the Optimization page or our research paper Constrained Local Search for Last-Mile Routing. Head over to the Routes page to view interactive map drawings of several of our tours. Links to the data sets, released by Amazon, can be found on the Data page.
William Cook, Combinatorics and Optimization, University of Waterloo, Canada
Stephan Held, Research Institute for Discrete Mathematics, University of Bonn, Germany
Keld Helsgaun, Department of People and Technology, Roskilde University, Denmark
We thank the competition organizers Julian Pachon (Director WW Last Mile Science at Amazon), Daniel Merchán (Senior Research Scientist at Amazon), Yossi Sheffi (Director, MIT Center for Transportation and Logistics), and Matthias Winkenbach (Director, MIT Megacity Logistics Lab), and thank also their teams at Amazon and MIT.
Our map drawings were created with the Leaflet open-source JavaScript library for mobile-friendly interactive maps.
The Amazon delivery vans photo was taken by Todd Van Hoosear and is available under the Creative Commons Attribution-Share Alike license.