 |
Plots
|
|
 |
Plots
|
|
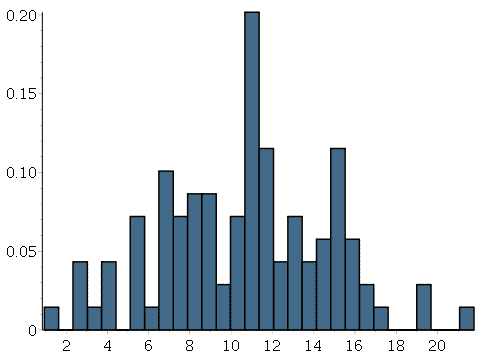
The following is simple code that will generate a nice histogram of a normally distributed variable, and return the median as well.
$mean=range(10,20);
$sd=range(1,5,0.1); $temp = maple("with(Statistics) : X := Sample(RandomVariable(Normal($mean, $sd)), 100) : M := Median(X) : Y := convert(X, 'string'); M, Y"); $median = switch(0, $temp); $data = switch(1, $temp); $plot = plotmaple("with(Statistics):Histogram($data)"); This will yield a nice looking histogram like this:  |
| Plots Index | Last updated: 07/18/2019 SS/MUO |