 |
Plots
|
|
 |
Plots
|
|
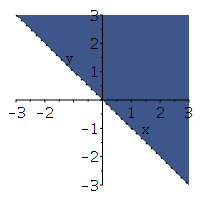
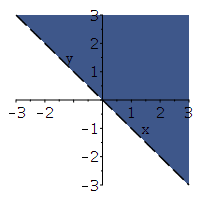
Inequalities can be plotted using the plots:-inequal command: $Plot1=plotmaple("plots:-inequal(0 < x+y, x = -3 .. 3, y = -3 .. 3)");  You can change the boundary with the options.... parameters: $Plot2=plotmaple("plots:-inequal(0 < x+y, x = -3 .. 3, y = -3 .. 3, optionsopen = [linestyle = 'dash'])");  |
| Plots Index | Last updated: 07/18/2019 SS/MUO |