 |
Maple Issues: Inline Plot Script |
|
|
Maple Issues: Inline Plot Script |
|
|
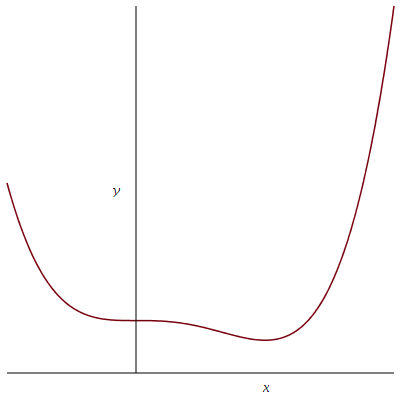
It is possible to generate plots in-line, that is without having to define them in the algorithmic section. Here is an example:
|
| Maple Issues Index | Last updated: 2023/11/06 SS/DAG |