|
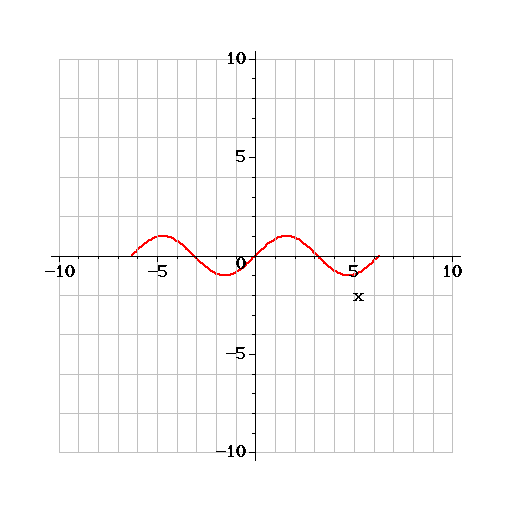
The following code in the algorithmic section:
$xMax = 10;
$xMin = -10;
$yMax = 10;
$yMin = -10;
$xGrid = 1;
$yGrid = 2;
$fcn = "sin(x)";
$plot = plotmaple("
with(plots):
gridLinesX:=seq(plot([i,t,t=$yMin..$yMax],color=grey),i=$xMin..$xMax,$xGrid):
gridLinesY:=seq(plot([t,i,t=$xMin..$xMax],color=grey),i=$yMin..$yMax,$yGrid):
toPlot := plot($fcn,thickness=2):
display(gridLinesX,gridLinesY,toPlot);
");
will generate a graph with gridlines like the following:

|
