 |
Enhancements
|
|
|
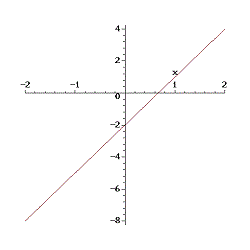
Maple's default setting places the axes labels poorly (or not at all). For example a simple graph generated by plotmaple: $P1=plotmaple("plot(3*x-2, x=-2..2) ");Places the x-axis label as shown: 
To place axes labels in more "traditional" locations use code like the following : $P2=plotmaple("plots[display]([plot(3*x-2,x=-5..5,y=-10..10),plots[textplot]([0,10,'y'],align = {above,right}),plots[textplot]([5,0,'x'],align = {above,right})],labels = [``,``],axes = normal)"); That will move the labels as shown:
|
| Enhancements Index | Last updated: 03/26/2020 SS/DAG |