Statistics in short
| Solved | April 20, 04:16 AM CST | ||
| CPU Time used (sec) | 585936700 | ||
| Optimal Solution | 1573084 | ||
| Data | D15112 |
 |
 |
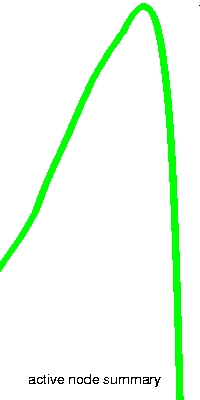 |
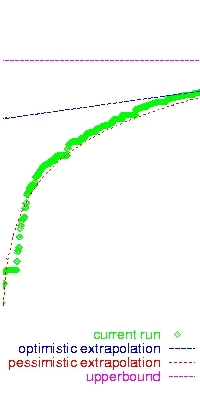
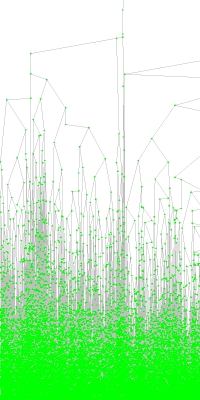
| Lower Bound Progress | Branch and Bound Tree | Active Nodes |
The charts above are compiled on the basis of information that was periodically written by the TSP processes while they worked towards a solution. Click on the images above to see detailed charts and their explanations.

CPU Time Used: The cpu time used in the branch and bound computation. CPU times on various machine types are just added together, so this does not reflect the CPU time on any one type of CPU. This time does not include the time spent working on the upper and lower bounds of the root node, prior to beginning branch and bound.
Optimal Solution: The upper bound on the solution value is just the length of the best tour known, shown here. Because the edge lengths are all integers, the lower bound shows that this tour is indeed the optimal solution.