100,000,000 is a lot of points. Even drawing the tour is a challenge. Fortunately, the great three.js JavaScript 3D library (thanks Mr.doob) can handle even data sets of this size. It's beautiful to see the big tour rendered in a browser, allowing zooming and panning to reveal its 3D structure. The data file is too large to post on the webserver, but please check out some of the static three.js-generated images below. And if you have a fast internet connection, you can always pop over to the interactive views of the 10,000,000-star tour.
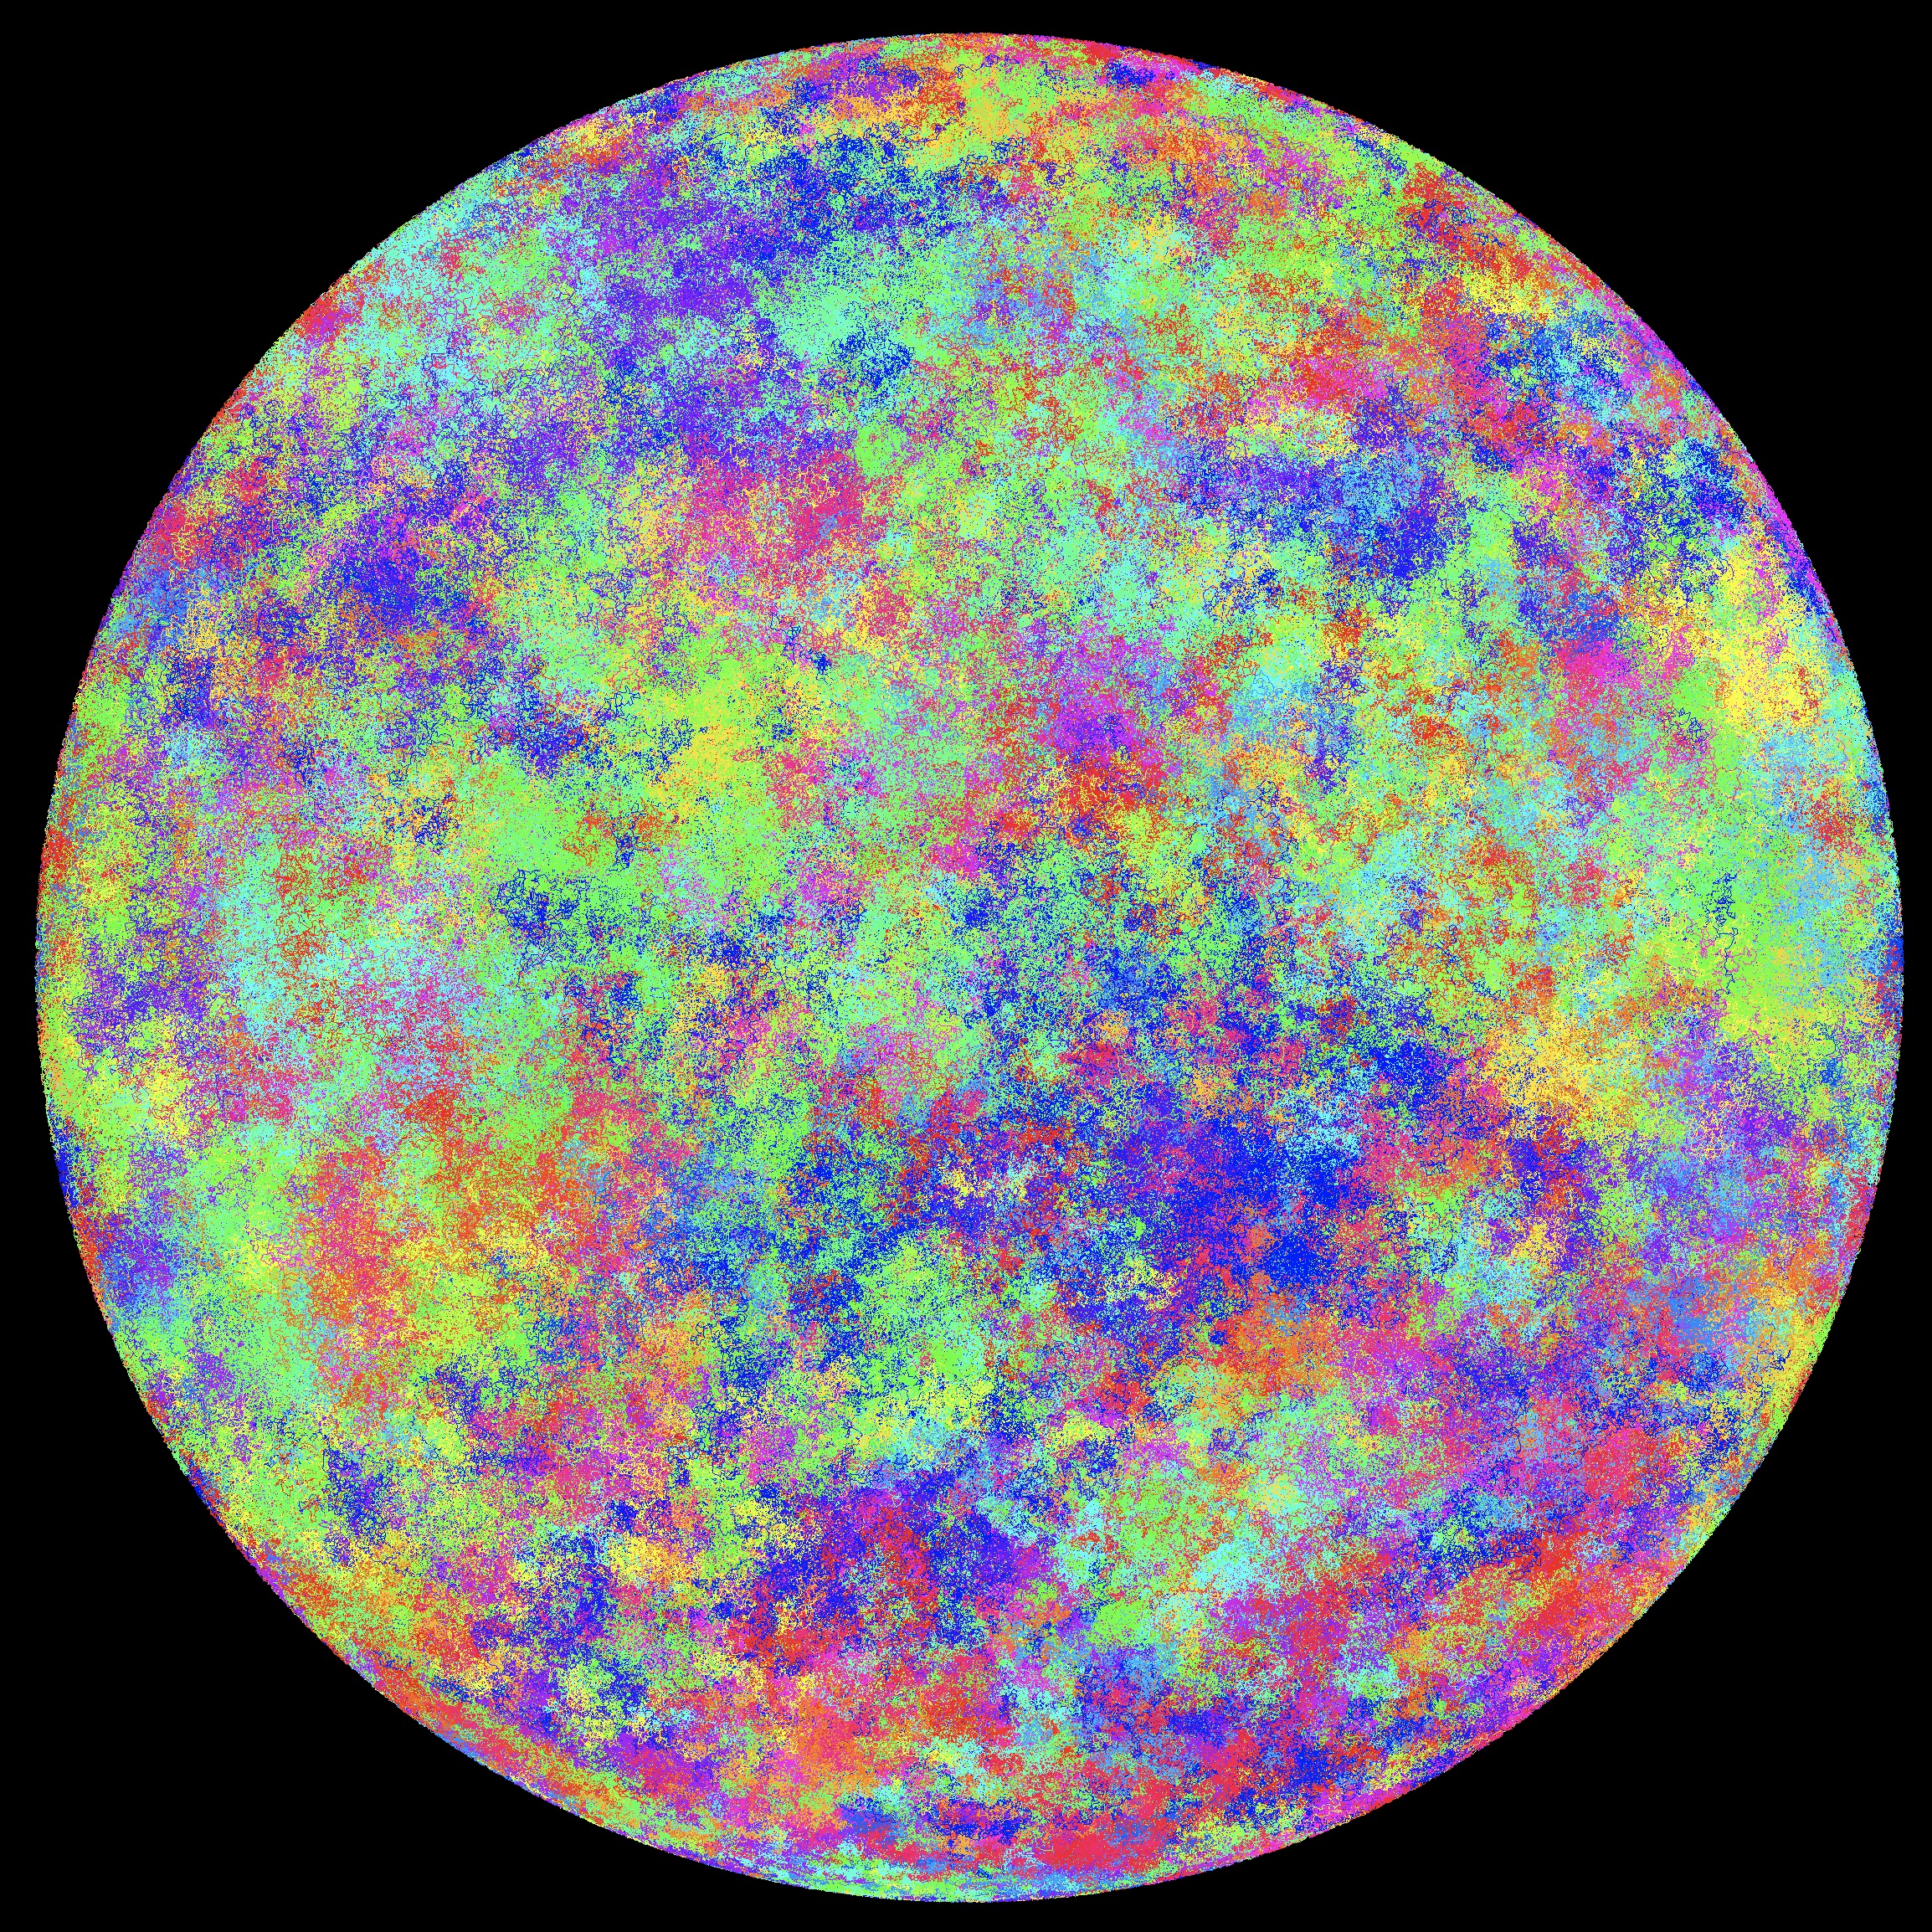
Full view of the 100 million star tour. It looks like a marble, but the colors are the individual star-to-star edges in the tour.

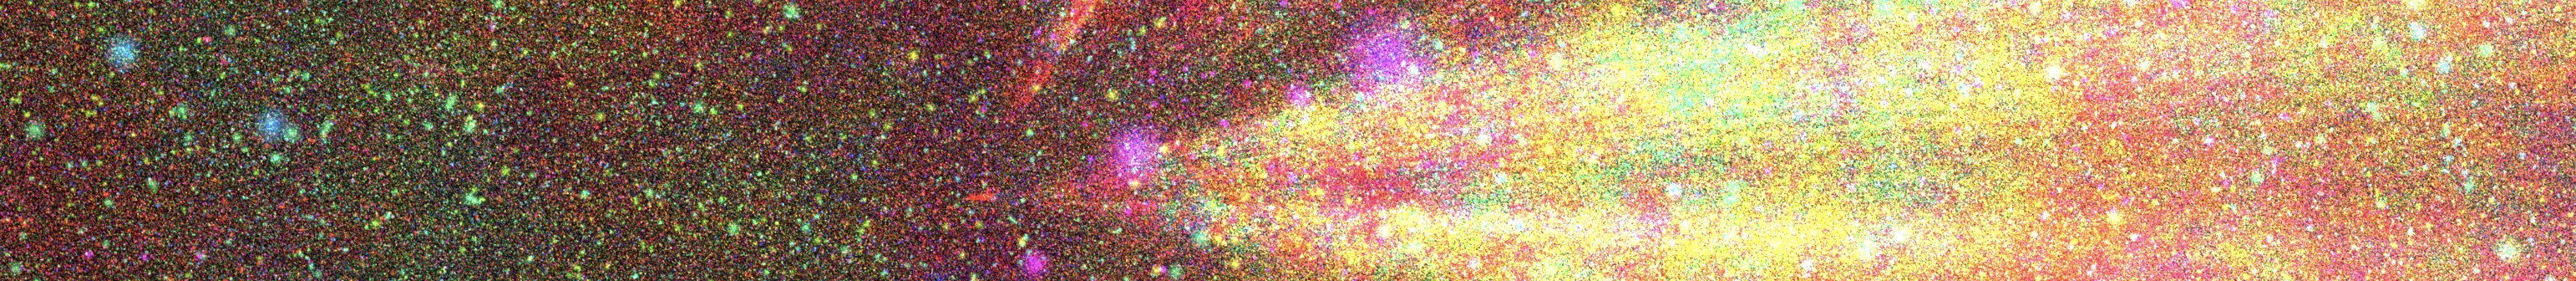
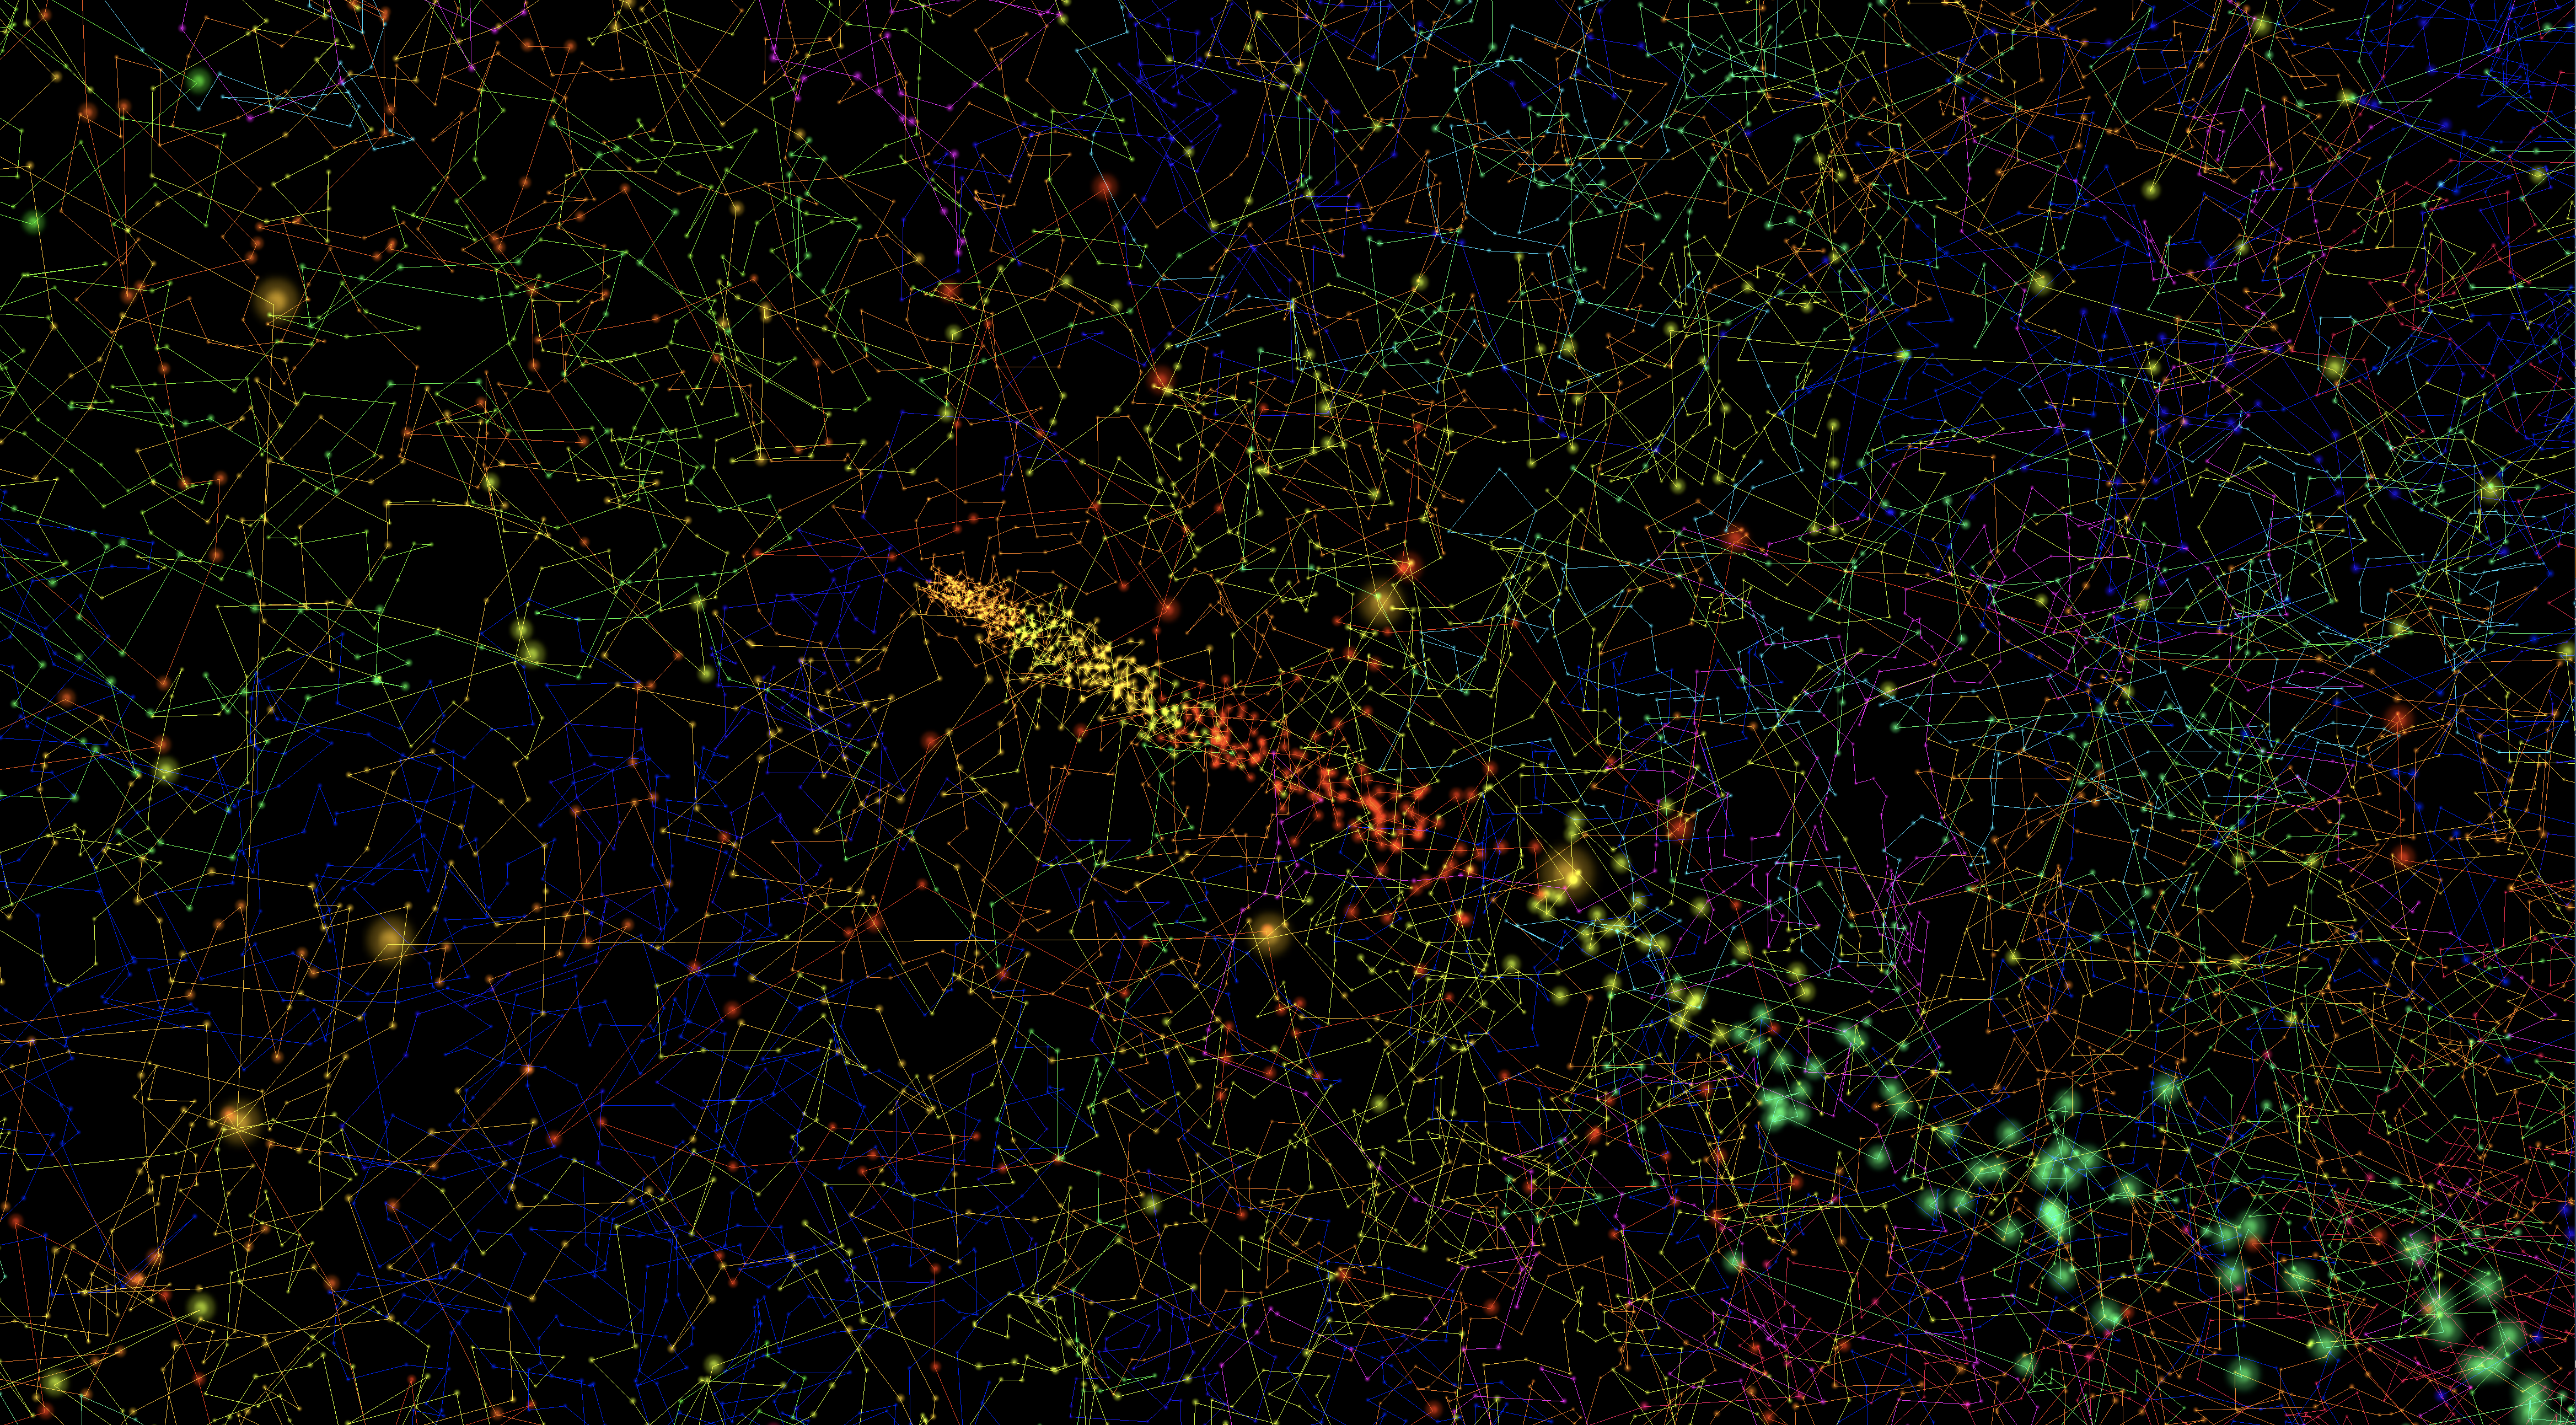
A close-up view shows the 3D-complexity of the tour. The edges are colored in tour order, allowing you to pick out long segments of the route.

Even closer, you can easily see the tour passing through the stars. Again, use the colors to keep track of the tour segments.
Here is a close-up of one of the cone-like structures radiating out from the center of the point set.
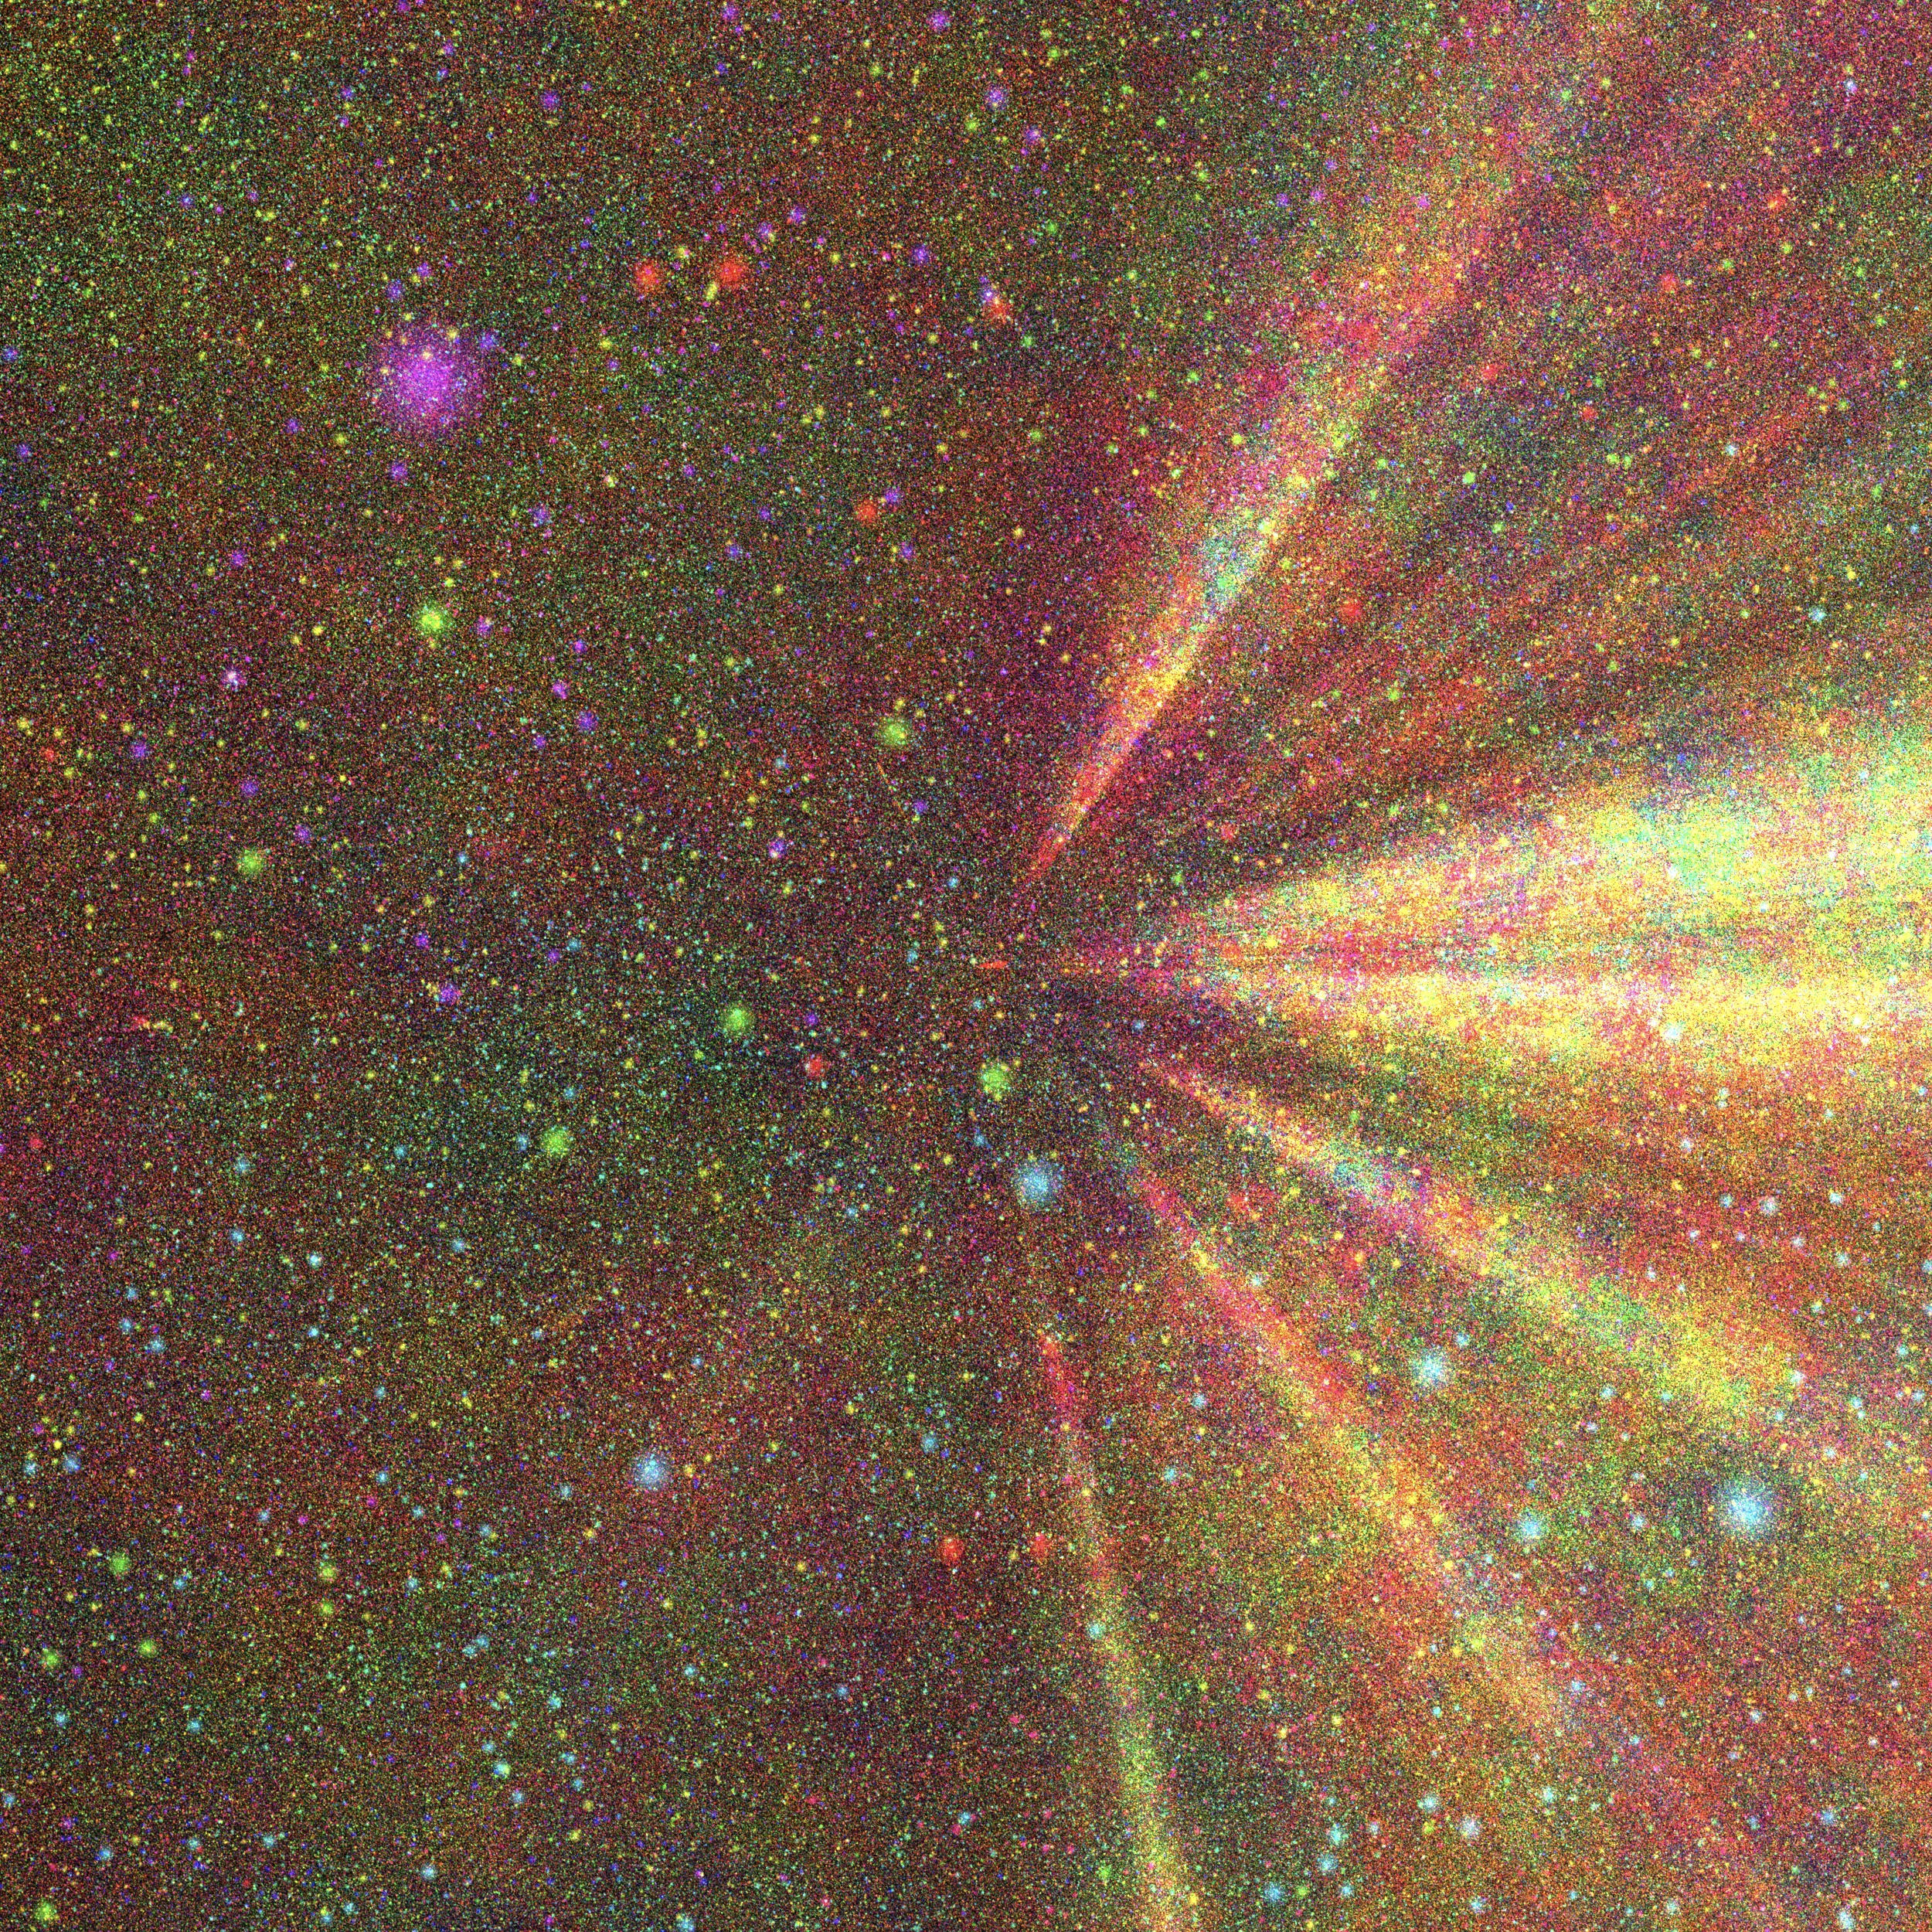
Zooming out, the cone-like structures are prominent. In this image, the tour is represented by the colors of the points, without the star-to-star edges.
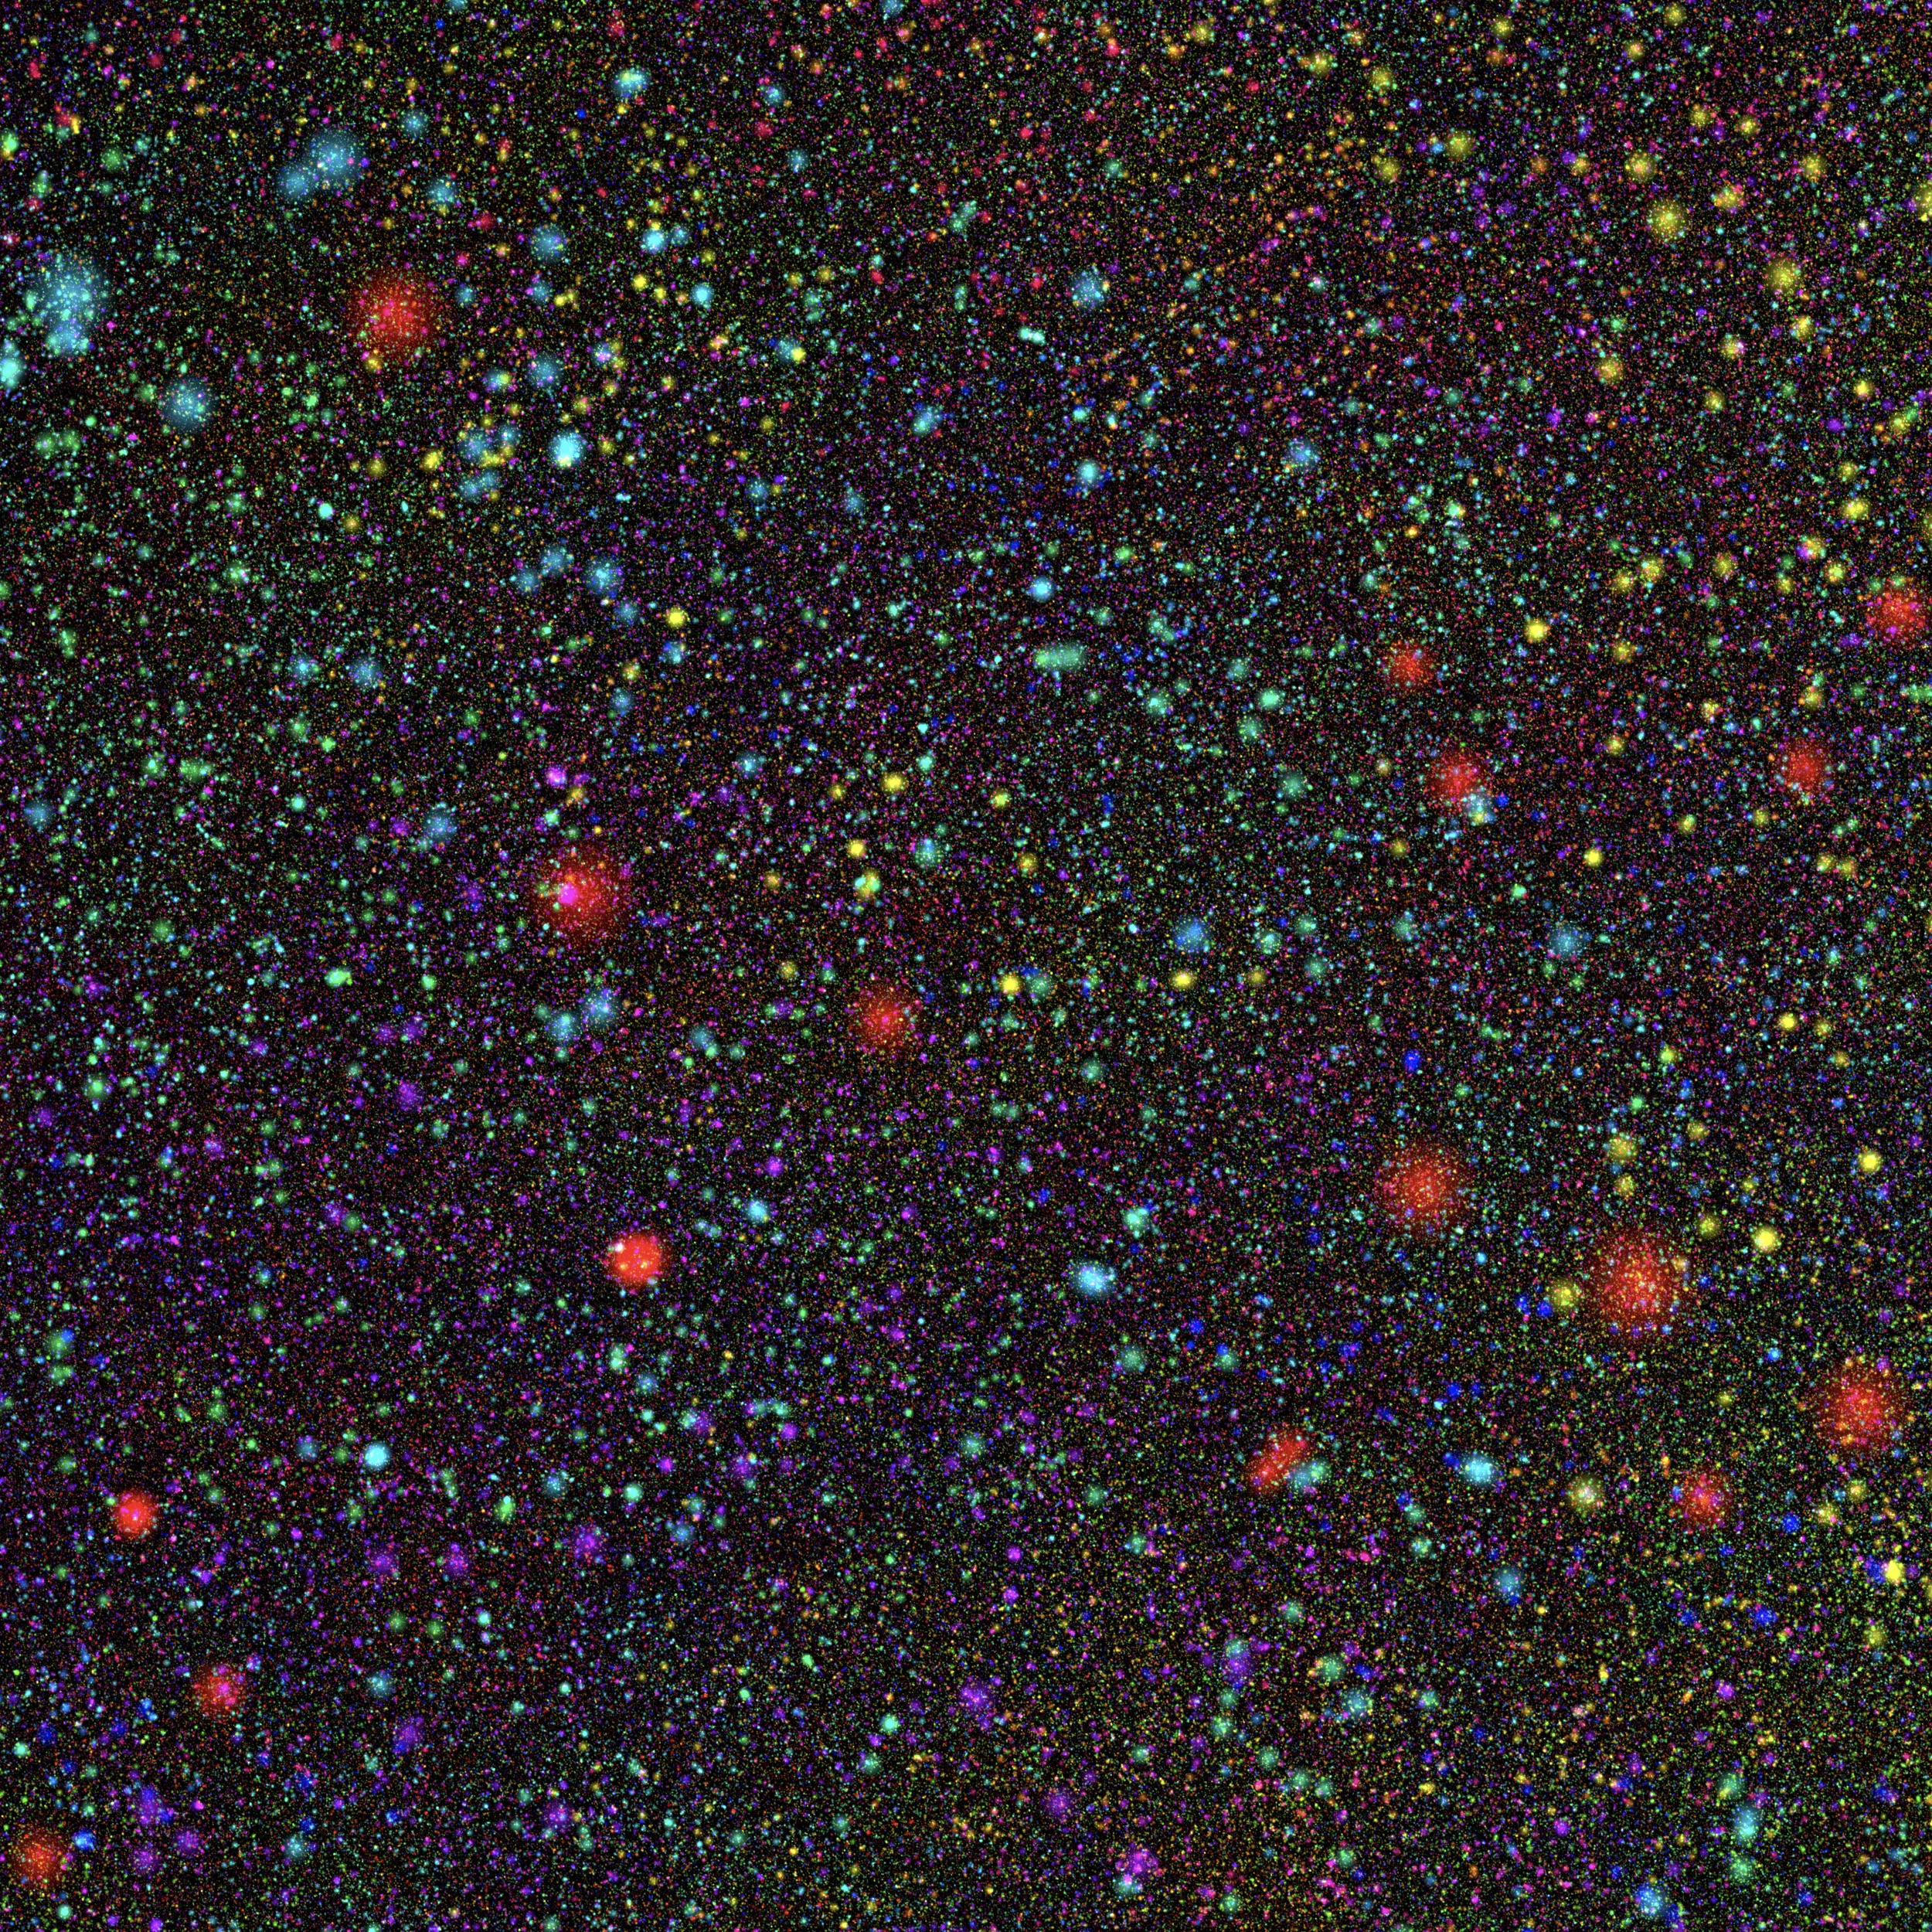
Another view without the star-to-star edges. The large red points represent stars that are close to the camera position; the similar hue means they are near to one another in the tour order.
The tour is rendered with the three.js JavaScript 3D library.
We thank Michael Boyle for suggesting the use of color hue to indicate the order stars appear in our solution.